
Recently I have been simulating 100,000 renewals of high-class Flat older-horse Flat races by using recent (2018 on) RPR data from the runners as a means of predicting how likely each horse was to achieve a certain RPR (and win, or place, in each simulation). The main goal of of course is to pinpoint some value. The early signs have been promising.
Here I provide results for the Lennox Stakes after following the same method. This is a relatively good race to perform these simulations on, given that most of the runners have a fairly comprehensive back-history of running in Graded/Group/Listed company and a lot of RPR data to work with.
Data and Method
I used exactly the same base method as described previously (see the Queen Anne post for more detailed information). More briefly, I:
- Recorded the RPR average (mean) and standard deviation (a measure of the variation around the mean) of all horses from turf Group/Graded/Listed races in 2018 and 2019 (note that I used handicap races for Flaming Spear, without which there would have been insufficient data to assess his chance)
- Computed 100,000 potential RPRs for each horse by using the analysis software, R, and a “truncated” normal distribution algorithm (with the lower limits set at a possible RPR of 0 and the upper at 3lb above each horse’s highest recent RPR)
- Ranked horses from highest RPR to lowest in each of the 100,000 simulated renewals and then calculated the proportion of these that each horse won (highest RPR) and placed in (highest three RPRs)
- Computed “fair” win and place odds for each horse based on these proportions
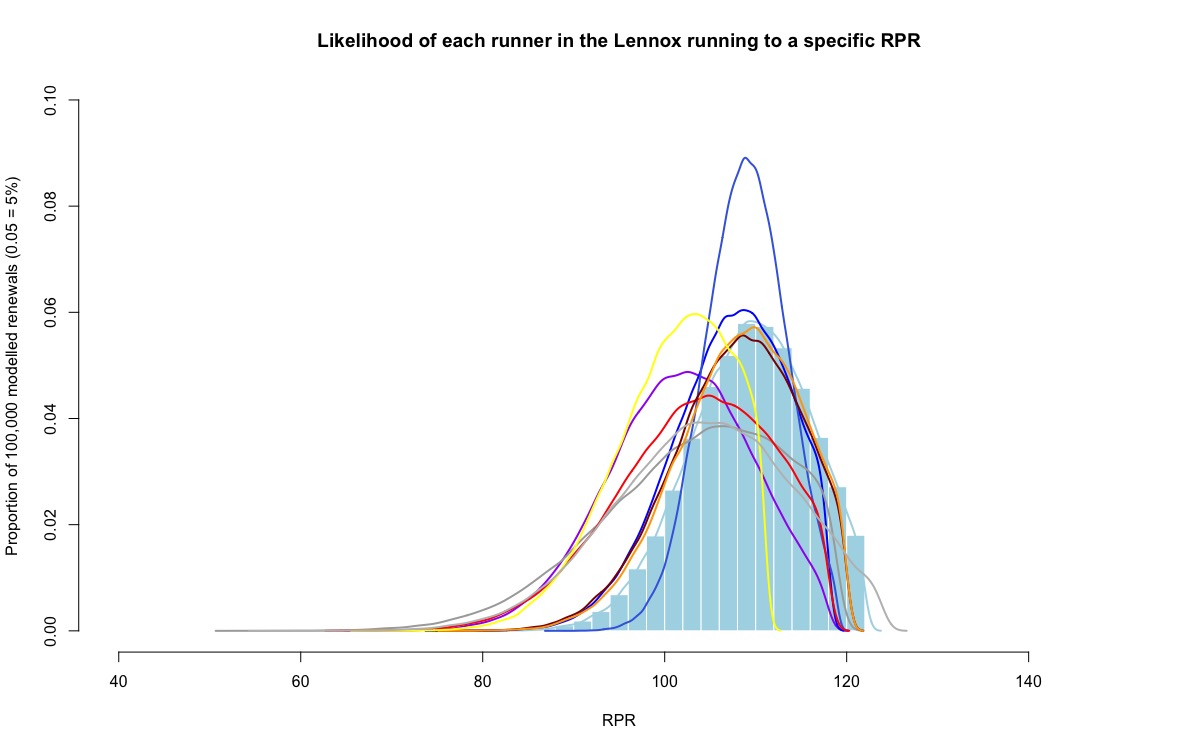
Shown above are the likely RPRs for each runner in the Lennox. The light blue bars and curve show Sir Dancealot’s likelihoods; the purple curve Breton Rock; the light blue Donjuan Triumphant; the blue (tallest peak) Flaming Spear; the grey Hey Gaman; the red Speak In Colours; the dark red Suedois; the orange Zaaki; the yellow Pretty Baby; the light grey Space Traveller.
Results
According to the simulations Sir Dancealot should be outright favourite at around 5 (4-1) and in the place market (around 2.1 or 11-10) —see Table below.
|
Horse
|
Fair Win Odds |
Fair Place Odds |
| Breton Rock | 31.3 | 7.1 |
| Donjuan Triumphant | 10.8 | 2.9 |
| Flaming Spear | 11.1 | 2.5 |
| Hey Gaman | 10.8 | 3.7 |
| Sir Dancealot | 5 | 2.1 |
| Speak In Colours | 15.9 | 4.4 |
| Suedois | 7 | 2.5 |
| Zaaki | 6.7 | 2.4 |
| Pretty Baby | 352 | 18.4 |
| Space Traveller | 7.5 | 3.5 |
There are a number of additional points of note. These include:
- Hey Gaman and Pretty Baby being a good bit bigger according to the simulations than with the bookmakers
- Donjuan Triumphant being a good bit shorter according to the simulations than he is with the bookmakers
- Each horse’s fair win odds correlate very closely with their fair place odds R2 = 0.94, or 94%); as such there is no concrete example of a horse that has a much better/worse chance of winning than its place chances may imply
Advised bet(s) and staking plans
I am trialling this simulation method from a punting point of view, and am tracking advised bets via a:
- a) Points-based staking plan (based on the perceived value available — see here for more info) beginning at a P&L of 0
- b) Conservative (1/4) Kelly Criterion statistic(see here for more info) beginning with a fictional bank of 1000 euro
In this instance, I don’t see quite a sufficiently large discrepancy between my simulated odds and those available with the bookmakers to justify a bet.
The two that are most tempting are Sir Dancealot (13-8 in the place market versus 11-10 in my model) and Suedois (9-4 in the place market versus 6-4 in my model).
Limitations
The model is only as good as the data that is fed into it. While RPRs are a relatively solid way of assessing a horse’s ability based on past performances, there are examples when you should be less confident in its use than others.
Flaming Spear’s chances have been all-but entirely assessed on handicap RPRs, but these races present different tests to Group races. As such, I am not overly confident in the way the model has assessed him (although, for what it’s worth, the bookmakers have rated his chances very similarly).
The model essentially averages the achievements (RPR) and consistency (variation in RPR) of all the runners based on their performances (in most cases) under a variety of different conditions over the past 18 months. However, horses with notable preferences for certain conditions may be favoured (or hindered) much more than those assessments would imply today. An example in practice is likely to be Donjuan Triumphant, who would have a much better chance on softer ground (which he won’t get today). The model therefore likely overestimates his chances here.
Future Directions
I will be using this technique to produce “fair odds” for Hong Kong racing beginning next season. HK fare is appealing for this type of analysis as there is a huge amount of ultra-reliable data available to work with.
I plan to produce my own sectional-enhanced speed ratings for all horses running in HK and use these instead of RPRs to model “fair odds” ahead of many of the meetings.
Watch this space.