Earlier this week I simulated 100,000 renewals of both the Queen Anne and Prince Of Wales’s Stakes at Royal Ascot by using recent (2018 on) RPR data from the runners as a means of predicting how likely each horse was to achieve a certain RPR (and win, or place, in each simulation). The main goal of doing that was of course to pinpoint some value.
The early signs have been promising. My model suggested Crystal Ocean was by far and away the likeliest winner of the Prince Of Wales’s Stakes as well as indicating that the first two in the Queen Anne had much better chances than the bookmakers thought. It additionally pinpointed a couple of shorter-priced fancies that looked under-priced (and which duly failed to make the frame).
Here I provide results for the Hardwicke Stakes after following the same method. This is a relatively good race to perform these simulations on, given that most of the runners have a relatively comprehensive back-history of running in Graded/Group/Listed company and a lot of RPR data to work with. However, the lack of a recent run from Masar makes things a bit tricky…
Data and Method
I used exactly the same base method as described previously (see the Queen Anne post for more detailed information). More briefly, I:
- Recorded the RPR average (mean) and standard deviation (a measure of the variation around the mean) of all horses from turf Group/Graded/Listed races in 2018 and 2019
- Computed 100,000 potential RPRs for each horse by using the analysis software, R, and a “truncated” normal distribution algorithm(with the lower limits set at a possible RPR of 0 and the upper at 7lb above each horse’s highest recent RPR) — see figure below
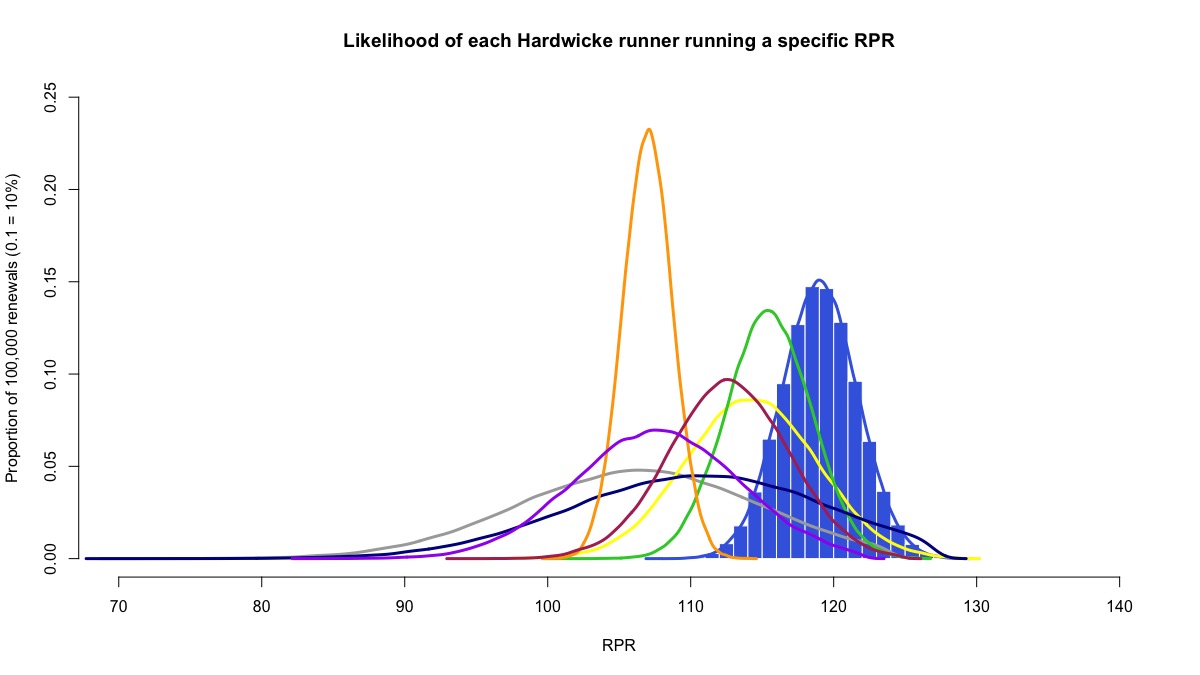
The likelihood of each runner running to a certain RPR is shown above (Masar blue bars and curve; Communique grey curve; Defoe yellow curve; Mirage Dancer green curve; Morando dark blue curve; Nagano Gold orange curve; Salouen maroon curve; Southern France purple curve).
- I then ranked horses from highest RPR to lowest in each of the 100,000 simulated renewals and then calculated the proportion of these that each horse won (highest RPR) and placed in (highest three RPRs)
- Computed “fair” win and place odds for each horse based on these proportions
Results
According to the simulations Masar should be outright favourite at around 2.1 (11-10) and extremely short in the place market (around 1-9) —see Table below.
| Horse | Fair Win Odds | Fair Place Odds |
| Communique | 25.2 | 6.8 |
| Defoe | 8 | 2 |
| Masar | 1.89 | 1.06 |
| Mirage Dancer | 9.4 | 1.53 |
| Morando | 7.7 | 3.2 |
| Nagano Gold | – | 373 |
| Salouen | 18.9 | 2.95 |
| Southern France | 66.3 | 9.2 |
| Lah Ti Dar | NR | NR |
There are a number of additional points of note. These include:
- Defoe, Mirage Dancer, and especially Southern France are a good bit bigger in the betting according to the simulations than with the bookmakers – although the strength in Masar is responsible for inflating these (see limitations below)
- Each horse’s fair win odds only correlate relatively closely with their fair place odds R2 = 0.78, or 78%); the notable one here is Morando, who is quite short in the win market compared to the place market – this is due to his ability to run a high figure but relative lack of consistency (sometimes he would be likely to run well enough to win, but quite often run well below that level and not even hit the frame)
Limitations
As mentioned before, a model is only as good as the data that is fed into it. While RPRs are a relatively solid way of assessing a horse’s ability based on past performances, there are examples when you should be less confident in its use than others.
Of the three sample analyses of this type conducted this week, I am least confident about this one given the make-up of the race.
Masar has a massive chance on last season’s RPRs (both in terms of his ability and consistency), but this represents his first run following a long layoff after injury and it is not a given that he will return in A1 shape. Last season’s RPR data for him naturally inflates all the other runners’ prices as it makes him so short.
Morando is also an interesting case. He has the ability to run a good RPR but is one of the least consistent in the field. As a result, the simulations show him running figures sufficient to win around 1 in 8 renewals, which makes him second-favourite according to the model in the win market. However, his inconsistency makes him only sixth-favourite in the place market. His (dark blue) curve helps illustrate that he has a greater variation (from poor to excellent) in likely RPRs than any of the others.
Under different circumstances, I would argue that this sort of discrepancy is the golden nugget that this unique analysis can provide that would be missed by most punters – however, in this case, the RPR that suggests he can run a race-winning figure when on a going day comes from an eight-length win at Chester on soft ground (a specialist track at which form can be hard to rate, and in a race in which the highly rated runner-up may not have run anywhere near to form). That said, Morando won very easily, so anyone using these data to form an opinion on possible value must form their own conclusions!
Future Directions
I will be using this technique to produce “fair odds” for Hong Kong racing beginning next season. HK fare is appealing for this type of analysis as there is a huge amount of ultra-reliable data available to work with.
I plan to produce my own sectional-enhanced speed ratings for all horses running in HK and use these instead of RPRs to model “fair odds” ahead of many of the meetings.
Watch this space.