
Today’s Happy Valley card featured four sprints over 1200m (6f) and each one was run a little differently, confirming that there is no one-style-fits-all approach to finding a winner around this sharp circuit (although being drawn low is generally a boost).
The abundance of data provided by the Hong Kong Jockey Club means it is easy to pull apart the way each race was run using sectional times and then assess whether any of the horses in these races were likely flattered, as well as comparing them to other horses who have won (or run) over the course and distance this season to put some marker on the level of performance.
So, firstly, what is a “good” speed rating on my scale for horses winning over 12oo m at Happy Valley? The figure below gives some insight (note that it only includes data for horses in Class 2 and 3 races). The highest speed rating achieved by any horse over this trip this season was the 99.8 I awarded to Amazing Star, who won race 379 on January 29.
Today, Shining Gem (who won race 618) earned a rating of 96.2, which is good but not exceptional (there are almost 50 “faster” times run by winners and beaten horses this season), and Good For You earned an almost identical rating of 96.1 in race 620. Neither of these races looks overly hot, then, when compared to season-long data, but that doesn’t mean there won’t be horses from either to follow subsequently.
Besides just watching the races, how do you pick out an eyecatcher?
Well, below is another figure that uses sectional data for each horse in both these races, and for each horse in the two earlier Class 4 races over 1200m for interest sake. This figure shows heat map data, which breaks the 1200 m into three separate sections of 400 m. It basically helps visualise how each horse ran its race in comparison with the other runners (red = fast, yellow = slow, relatively speaking).
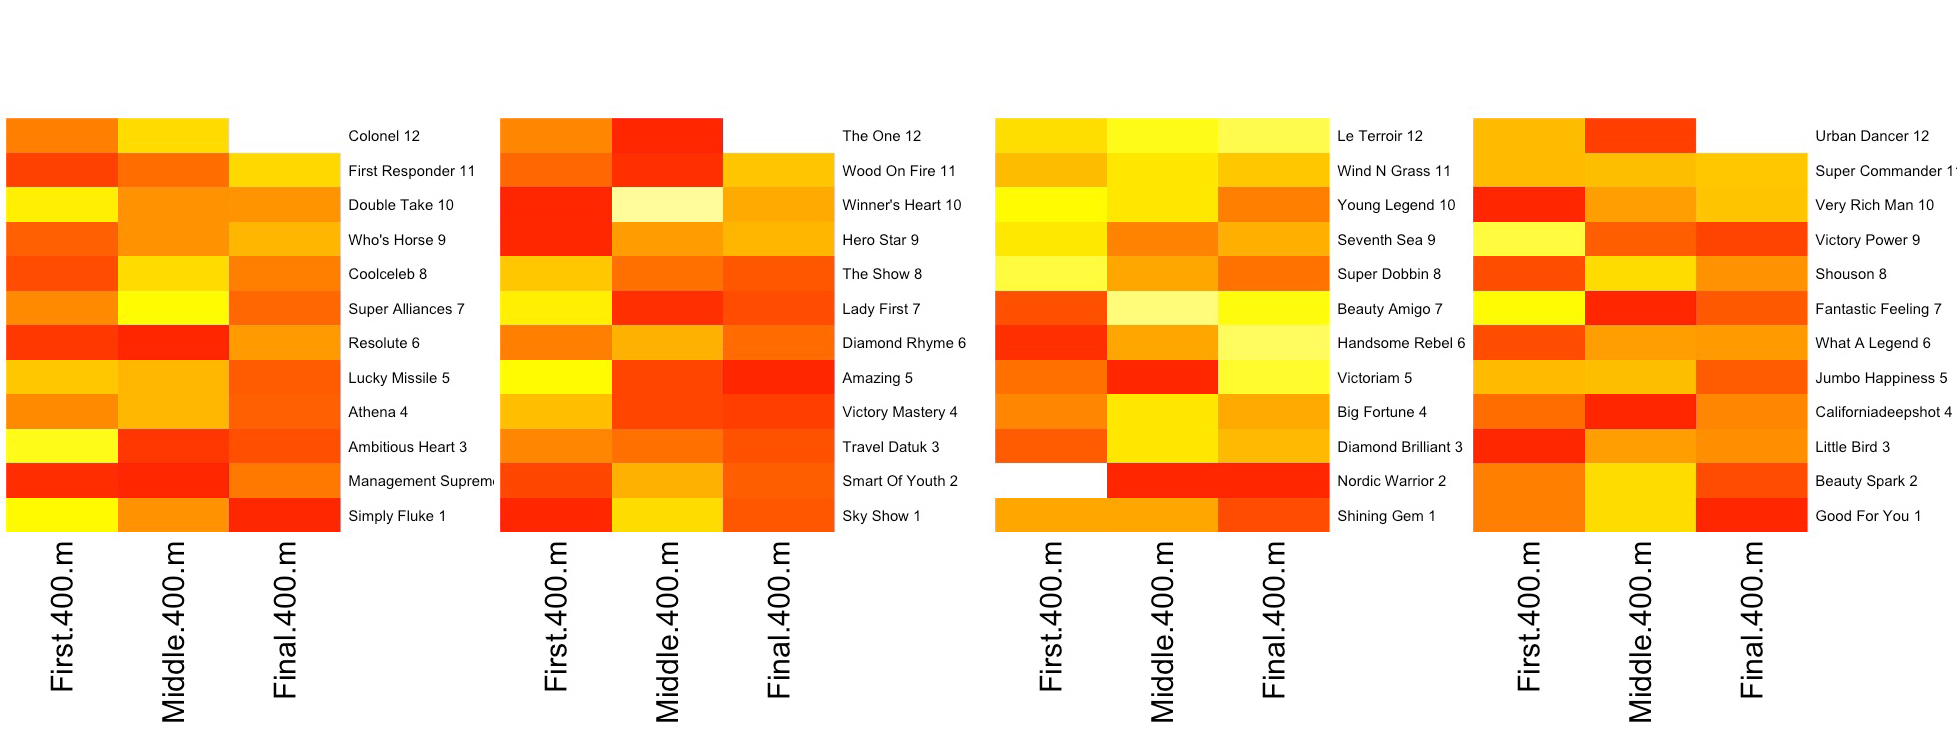
It stands to reason that the winners and placed horses in most races are likely to have run “efficiently” and thus, any horses that finished close to them while running very different styles of races have probably overachieved, given that they have used their energy in a very different way.
Both Nordic Warrior (second in race 618) and Little Bird (third in race 620) ran very different races to those ahead of them and are two to consider putting in your tracker.
Another useful statistical test that also produces figures that can help you visualise how differently horses actually ran a race is a distance matrix. These simply compare each horse’s sectional with those run by its competitors at each stage of the race, and then group horses into “clades” that essentially ran similar races.
You can see examples from today’s races below.

The thing to keep in mind when reading these is that the point at which different branches split away from others indicates how different they are from one another (e.g. read top-down, rather than right-left).
Using Race 620 as an example, the four horses split between three “clades” on the extreme right ran very different races to the rest of the rest of the field because the upper-most branch split away from the other groups above a relative difference of ‘4’. Those four horses all ran hugely different races to the rest of the runners for this reason. Urban Dancer was just as different as the rest were from the other eight, but he himself ran a different race to the other three on his side…
What these show me in combination with the heat maps is that Nordic Warrior ran a subtly similar race to the winner in his race, Shining Gem, so while I wouldn’t necessarily put people off backing him next time (after all, he ran an obviously good race), he perhaps wasn’t as unlucky in running as may have looked likely. And the same was true of Little Bird in the finale.
Two today who did seem to run very different races to those around them and still run very well were Management Supreme in Race 615 and Californiadeepshot in Race 620 (who ran hard most of the way without a breather — he was drawn wide and got no peace). Both may well be worth keeping an eye on.
Note: One word of warning: horses can and do win (or run well) when running inefficiently, so it’s not as simple as looking at these heat maps and distance matrices, picking out those who were competitive despite running differently to those immediately around them, and then putting them on your eyecatchers list. They do, however, offer another useful tool to add to the punting arsenal.